New York City's dirtiest restaurants
Introduction
In this project, we hope to find the correlation between sanitary condition of a restaurant in New York City and its environment. Based on restaurant inspections and rodent inspections, which represent the sanitary condition of the surrounding area. Then, we could perform machine learning algorithm to predict the sanitary condition of a restaurant or environment when either dataset is missing. However, the invetigation showed no correlation between the rodent inspection dataset and restaurant dataset. We, then, expect to based on the sanitary dataset of restaurants to build model that predict the sanitary condition of a restaurant which not included in the dataset.
Here is a link to the explainer notebook.
Here is a link to download the restaurant inspection dataset.
Here is a link to download the rodent inspection dataset.
Introduction of datasets
We aquired the two following data sets:
- Restaurant Inspection
In July 2010, the Health Department began requiring restaurants in all five boroughs (Manhattan, Bronx, Brooklyn, Queens and Staten Islands) to post letter grades summarizing their sanitary inspection score.
The purposes of the score is to inform the public about a restaurant’s sanitary condition; to improve the sanitary condition and food safety in restaurants.
The data set contains information about the Health Department's inspections of New York's 24.000 restaurants. Some of the most important variables are: Name, Score, Grade, Violation Description and Address.
- Rodent Inspection
Conducted by Department of Health and Mental Hygiene, and the earliest data can back to 2009.
How the restaurant inspections work
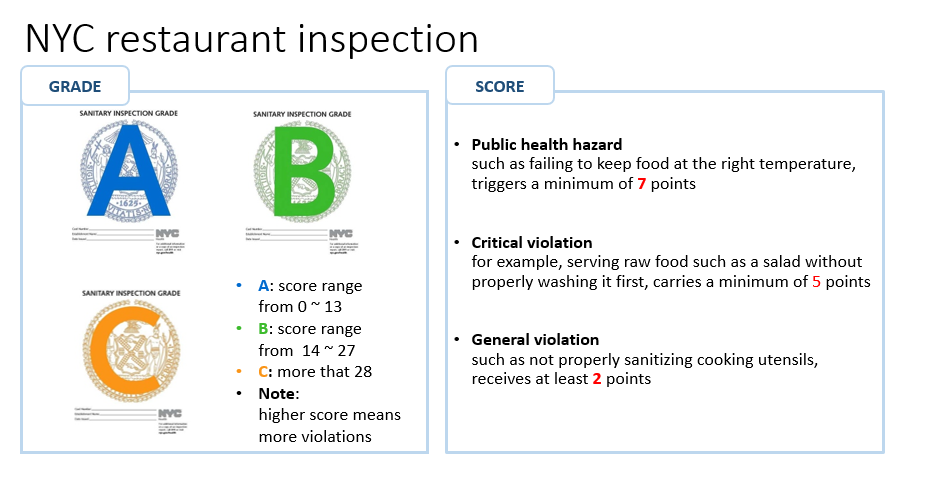
The restaurant being inspected gets a score corresponding to the violations registerd during the inspection. Violations are classified as "critical" or "general". As explained in the image above critical violations carry more points. Critical violations are more likely than general ones to contribute to food-borne illnesses. There are some critical violations that are thought to pose an immediate health threat. These critical violations carry the most points and are further classified as "public health hazards". If a restaurant does not correct a public health hazard the Health Department may close the restaurant immediately. Finally the sum of the points carried by the violations results in a grade. The restaurant gets an A if the final score is from 0 to 13, a B if the score is from 14 to 27 and a C if the score is higher than 27. In the table below the ten most common violations can be viewed. The table also shows the type of the violations and how often each violation was recorded from 2013-2016.
| Violation |
Count |
Type |
| Facility not vermin proof. Harborage or conditions conducive to attracting vermin to the premises and/or allowing vermin to exist. |
42337 |
General |
| Cold food item held above 41º F (smoked fish and reduced oxygen packaged foods above 38ºF) except during necessary preparation. |
35096 |
Public health hazard |
| Evidence of mice or live mice present in facility's food and/or non-food areas. |
31491 |
Critical |
| Food contact surface not properly washed, rinsed and sanitized after each use and following any activity when contamination may have occurred. |
27330 |
Critical |
| Food not protected from potential source of contamination during storage, preparation, transportation, display or service. |
24949 |
Critical |
| Plumbing not properly installed or maintained; anti-siphonage or backflow prevention device not provided where required; equipment or floor not properly drained; sewage disposal system in disrepair or not functioning properly. |
23847 |
General |
| Hot food item not held at or above 140ºF | 21455 |
Public health hazard |
| Filth flies or food/refuse/sewage-associated (FRSA) flies present in facility�s food and/or non-food areas. Filth flies include house flies, little house flies, blow flies, bottle flies and flesh flies. Food/refuse/sewage-associated flies include fruit flies, drain flies and Phorid flies. |
18997 |
Critical |
| Raw, cooked or prepared food is adulterated, contaminated, cross-contaminated, or not discarded in accordance with HACCP plan. |
11192 |
Public health hazard |
| Live roaches present in facility's food and/or non-food areas. |
10969 |
Critical |
Number of restaurants of cuisines with more than a hundred restaurants
There are 24861 restaurants that have been inspected regualarly since 2013. The restaurants are catagorized depending on their cuisine type. There are 84 different cusine types in the data set and to get a sense of the distribution we plot the distribution as pie charts. Since the majority of cuisines have less than a 100 restaurants plotting all cuisine types on one chart would result in a chart with micro sized slices. This is why first we plot a pie chart showing the number of restaurants of each cuisine type, where the cusine types with less than a hundred restaurants are plotted as one slice. This is the dark blue slice on the pie plot below. To see what cuisine type and the number of restaurants of that cusisine each slice represents please hover the slice with the mouse.
Number of restaurants of cuisines that have less than a hundred restaurants
As we can see on the pie chart above the American cuisine has the greatest number of restaurants in New York City. The New York City Health Department has inspected 6077 American restaurants regularly since 2013. The runner up is the Chinese cuisine with 2395 restaurants. The fact that there are so many Chinese restaurants was one of the reasons we chose to do a further analysis on the Chinese restaurants in NYC.
On the pie chart below we plot the number restaurants of cuisines that have less than a 100 restaurants. These restaurants are of little importance to us since there are so few of each cuisine type.
AVPV barchart
Average violation per visit (AVPV): summing up total violations of restaurants in same type of cuisine and divide by the total number of inspection visit.
In this barchart, we show difference of each cuisine comparing to the mean of AVPV.
Observed the top 20% cuisine (the first 17 cuisines) that has the most AVPV, Chinese relevant cuisine re-appear for 5 times, it draws our attention that Chinese restaurant tend to have larger probability to be bad sanitary conditions. In machine learning section, we are interested to predict the sanitary indices which are AVPV and grade.
Hover the map with the mouse pointer to see the grade a Chinese restaurant at that location is most likely to get.
Imagine you have just moved to New York City. To make a living you decide to open a Chinese restaurant but where in the big apple is the best place to do that? Of course there are many different things to take in to account when finding the perfect location for your restaurant. One important thing is how likely it is that your restaurant gets a good grade from the Health Department in the future. This can be determined by looking at what grade restaurants in the neighborhood have gotten in the past.
There are 2312 Chinese restaurants in NYC. We classify each restaurant according to the worst grade it has received since 2013. We take the worst grade because restaurants are given multiple opportunities to improve their grades and most of them eventually receive an A. Thus restaurants that have always been kept clean get classified as the best ones and the other ones have at some point failed to meet the requirements. Now we lay a grid of points over New York City. For each point P on the grid we look at the 10 restaurants that are closest to it. P gets classified in accordance to the class of the majority of its 10 nearest neighbors.
The dots on the map below represent the grade a Chinese restaurant is likely to get in that location. Green represents a grade A, yellow is for a grade B and red is for C. By hovering the mouse pointer over the map the grade of the corresponding dot can be viewed.
Machine Learning: AVPV regression
The number of training data is 2120 which contains the latitude, longitude, and AVPV. Based on the these point, we create 64x128 grid to make a dense prediction
If a newly open or planing to open a restaurant at certain place, one would like to know what is the potential average violations one might get, because it is relevant to the grade. Hovering through the map, one would know the prediction result of any point on the map, which is a good reference for making visit the restaurant at this location or even open one.
The region with the most violation is at the south of Brox, and north of Queens borough. Which is consensus to the prediction result of grade C.
Average score as a function of the ratio between active rat signs and the total number of inspections in each zip code
We tried to find a correlation between active rat signs and the average score in each zip code. The y-axis represent the ratio of active rat sign to total number of inspection, and the x-axis is the average score of corresponding zip code. The distribution of xy shows no correlation between these two parameters, and thus they are uncorrelated.